|

Chapter 3: Applications of Differentiation
Section 3.6: Related Rates

|
Example 3.6.3
|
|
|
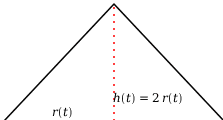
Sand pouring from a hopper at a steady rate forms a conical pile whose height is observed to remain twice the radius of the base of the cone. When the height of the pile is observed to be 20 ft, the radius of the base of the pile appears to be increasing at the rate of a foot every two minutes. How fast is the sand pouring from the hopper?
|
|
|
|
|
Solution
|
|
Figure 3.6.3(a) contains a cross section of the sand pile, taken through its axis. The analysis to the left of the figure distills the information that is given and clarifies what is to be found.
|
Analysis
|
|
Given
|
Find
|
|
when ,
i.e., when
|
|
|
|
|
|
>
|
p1:=plot([[-2,0],[2,0],[0,5],[-2,0]],style=line,color=black):
p2:=plot([[0,0],[0,5]],style=line,linestyle=dot,color=red):
p3:=plots:-textplot({[-.7,.4,typeset(r(t))],[1.3,1,typeset(h(t)=2*r(t))]},font=[Times,12],align=LEFT):
plots:-display(p1,p2,p3,axes=none);
|
|
|
Figure 3.6.3(a) Cross section of sand pile
|
|
|
|
|
Implementation
|
|
•
|
Write the volume in terms of .
Press the Enter key.
|
|
•
|
Context Panel: Differentiate≻With Respect To≻
|
|
|
| (1) |
|
|
•
|
Expression palette: Evaluation template
Make the following replacements:
|
|
•
|
Context Panel: Evaluate and Display Inline
|
|
=
|
|
|
|
•
|
The answer, , is in cubic feet per minute.
|
|
|
<< Previous Example Section 3.6
Next Example >>
© Maplesoft, a division of Waterloo Maple Inc., 2024. All rights reserved. This product is protected by copyright and distributed under licenses restricting its use, copying, distribution, and decompilation.
For more information on Maplesoft products and services, visit www.maplesoft.com
|


